Álver Alcoa Fjarðaáls á Reyðarfirði hóf rekstur árið 2007. Fjarðaál er eitt nútímalegasta og tæknivæddasta álver í heimi og er til fyrirmyndar hvað varðar umhverfisvernd. Álverið er það stærsta á Íslandi en framleiðslugeta þess er allt að 360 þúsund tonn af áli á ári. Meiri upplýsingar um starfsemi fyrirtækisins er að finna í Samfélagsskýrslunni okkar.
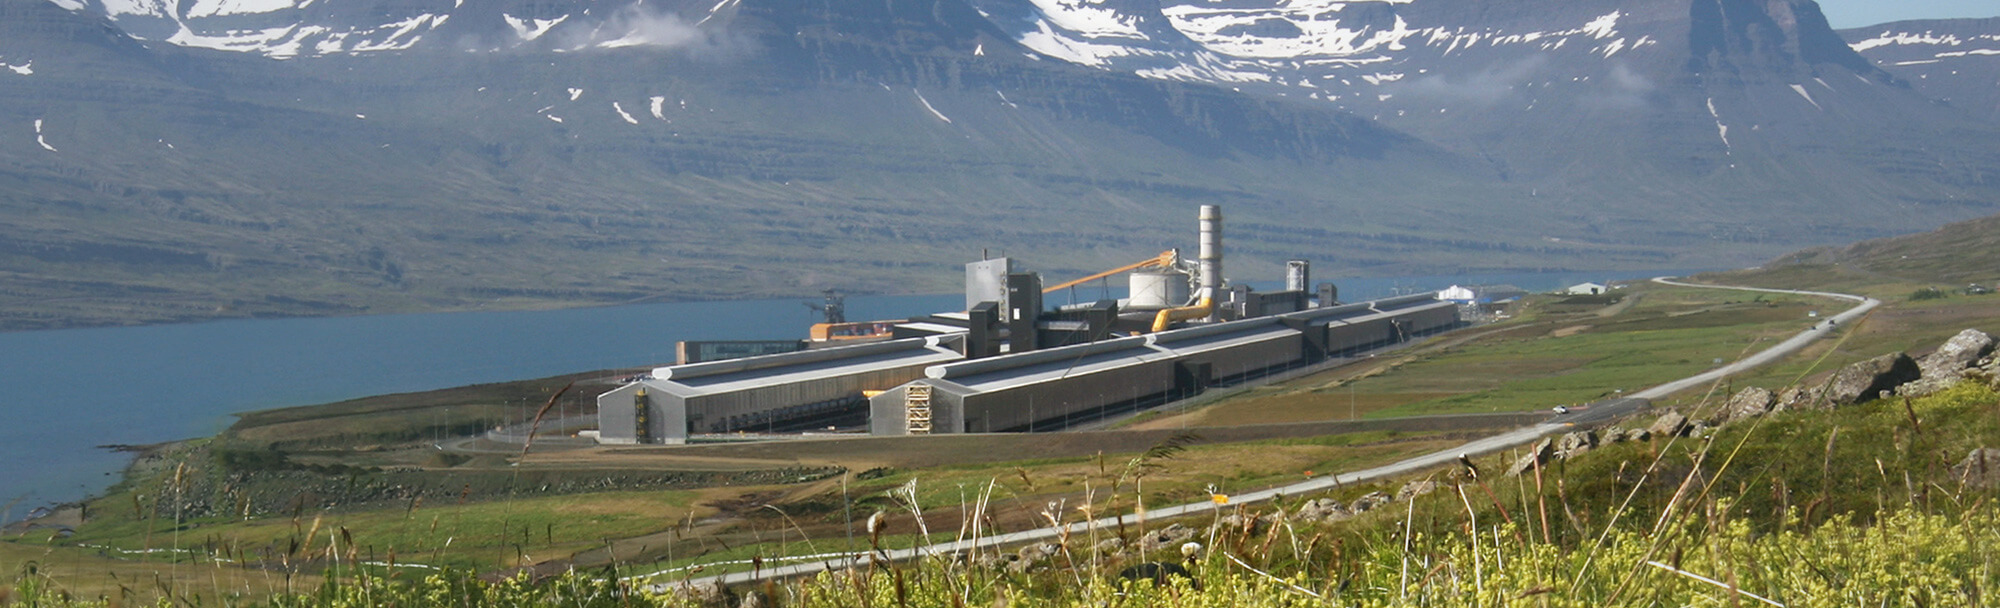
Álver Alcoa Fjarðaáls á Reyðarfirði er stærsta álver landsins. Hjá Fjarðaáli eru árlega framleidd um 344 þúsund tonn af hreinu gæðaáli og álblöndum.
Umsóknareyðublað vegna samfélagsstyrkja
Umsóknarfrestur er til 1. maí 2026. Umsóknir eru sendar inn í gegnum hlekkinn hér að ofan.
Samfélag
Samfélagsskýrsla: eykur gegnsæi og upplýsingagjöf
Á hverju ári skilar Alcoa Fjarðaál inn grænu bókhaldi ásamt skýrslu til Umhverfisstofnunar. Árið 2017 varð sú breyting að grænu bókhaldi er ekki skilað einu og sér, heldur er það hluti af samfélagsskýrslu sem unnin er skv. viðmiðum GRI.
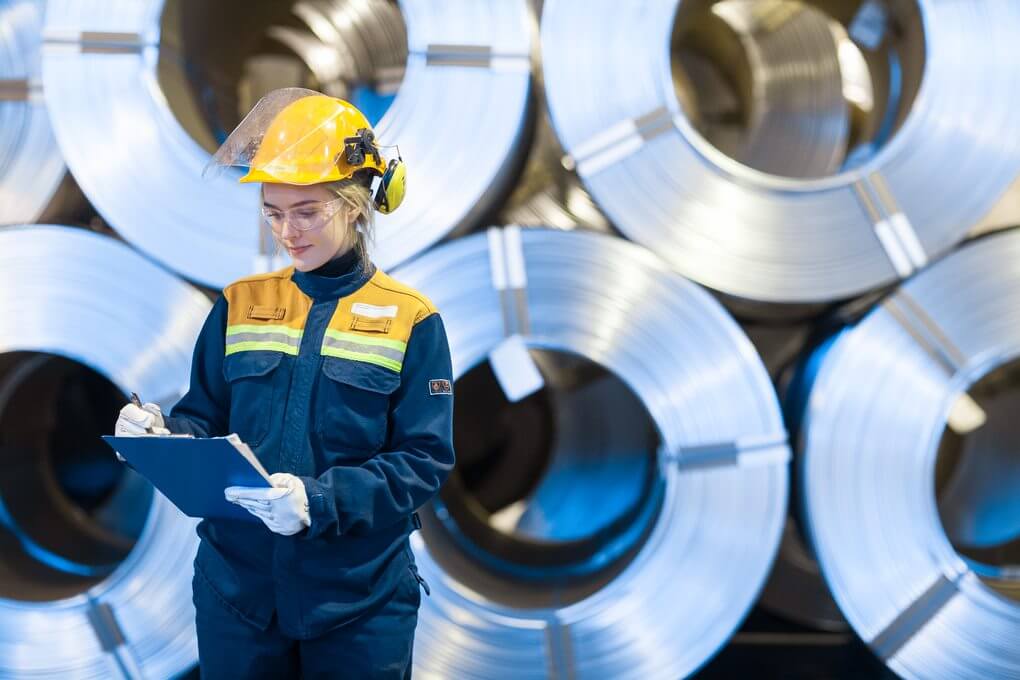
Störf í boði
Við leitum ávallt að duglegu og áreiðanlegu fólki til starfa - einstaklingum sem vilja höndla ábyrgð frá fyrsta degi og eiga farsælan starfsferil hjá Fjarðaáli. Á móti bjóðum við vinnustað sem er annt um sömu hluti og þú, frá umhverfinu til fjölskyldunnar og samfélagsins.
Sjá jafnréttisstefnu Fjarðaáls
bsi ISO 9001 Quality Management Systems CERTIFIED; ISO 14001 Environmental Management CERTIFIED; ÍST 85:2012 Equal Wage Management System CERTIFIED
Álver Alcoa Fjarðaáls á Reyðarfirði hóf rekstur árið 2007. Fjarðaál er eitt nútímalegasta og tæknivæddasta álver í heimi og er til fyrirmyndar hvað varðar umhverfisvernd. Álverið er það stærsta á Íslandi en framleiðslugeta þess er allt að 360 þúsund tonn af áli á ári. Meiri upplýsingar um starfsemi fyrirtækisins er að finna í Samfélagsskýrslunni okkar.
Umsóknareyðublað vegna samfélagsstyrkja
Umsóknarfrestur er til 1. maí 2026. Umsóknir eru sendar inn í gegnum hlekkinn hér að ofan.
Samfélag
Samfélagsskýrsla: eykur gegnsæi og upplýsingagjöf
Á hverju ári skilar Alcoa Fjarðaál inn grænu bókhaldi ásamt skýrslu til Umhverfisstofnunar. Árið 2017 varð sú breyting að grænu bókhaldi er ekki skilað einu og sér, heldur er það hluti af samfélagsskýrslu sem unnin er skv. viðmiðum GRI.
Störf í boði
Við leitum ávallt að duglegu og áreiðanlegu fólki til starfa - einstaklingum sem vilja höndla ábyrgð frá fyrsta degi og eiga farsælan starfsferil hjá Fjarðaáli. Á móti bjóðum við vinnustað sem er annt um sömu hluti og þú, frá umhverfinu til fjölskyldunnar og samfélagsins.
Sjá jafnréttisstefnu Fjarðaáls
bsi ISO 9001 Quality Management Systems CERTIFIED; ISO 14001 Environmental Management CERTIFIED; ÍST 85:2012 Equal Wage Management System CERTIFIED